Most people who want to “run a SOC at home” start by downloading a tool. That’s backwards. Before you pick a stack, you need a mental model — because every tool decision you make either fits the pipeline or fights it, and if you don’t know the pipeline, you can’t tell the difference.
This post is that mental model. By the end you’ll know what a SOC is doing, what you need to collect, how the collection layer works, which SIEM is worth your time at home, and how to think about retention without starving your machine. Then we’ll get concrete.
The One Mental Model You Need
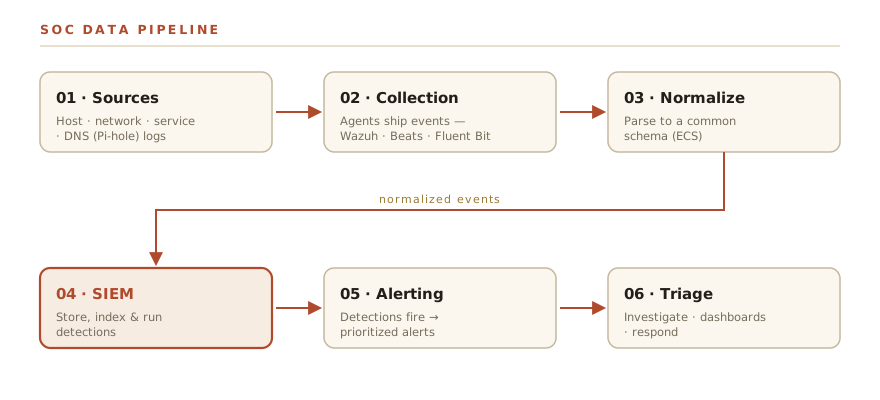
A SOC — Security Operations Center, corporate or homelab — is a single pipeline with six stages. Everything in this series maps to one of them:
Sources → Collection/Shipping → Parse/Normalize → Store/Index (SIEM) → Detect → Alert → Triage → Dashboards
That’s it. Strip away the vendor marketing, the product names, the conference theatre, and you have a pipeline that moves events from wherever they happened to a place where you can act on them. Each stage has exactly one job:
- Sources generate events: your Linux host, your firewall, your DNS server, your web server.
- Collection agents run on or near the source, read those events, and ship them somewhere central.
- Parsing and normalization translate “sshd[1234]: Failed password for root from 10.0.0.1 port 51234 ssh2” into a structured record with consistent field names — source IP, destination IP, event type, timestamp — so that detection rules can be written once and applied everywhere.
- The SIEM stores those normalized records and indexes them for fast search and correlation.
- Detection rules run against the event stream and produce alerts when something matches a pattern you care about.
- Alerting delivers those detections to you: a Telegram message, an email, a PagerDuty call if you’re running something enterprise-adjacent.
- Triage and dashboards are where a human looks at what the pipeline surfaced and decides whether it’s real.
Anchor everything on this. When someone tells you Wazuh is a SIEM, you now know enough to push back: it’s more accurately a HIDS with SIEM-adjacent capabilities that covers collection, normalization, and detection, with a dashboard that handles triage. When someone says Elastic is just a search engine, you can see that it’s the store/index layer that you wire the rest of the pipeline around. Ignore the product names; ask which stage a tool covers.
What to Collect at Home
The temptation is to collect everything. Resist it. You can only triage what you have time to look at, and a pipeline flooded with noise is worse than a narrower one you use. Collect what has signal. Add more when you’ve burned through the first layer.
Host logs — Linux
If you have Linux machines (and if you’re homelabbing, you do), start here. Two sources matter:
auditd watches system calls and produces a structured event for every file access, privilege escalation, process exec, and network connection that matches your rules. It’s noisy out of the box — you’ll need a ruleset like Florian Roth’s auditd rules to get meaningful signal without drowning in routine I/O. The payoff: it catches things like a process writing to /etc/passwd or a reverse shell spawning a bash child — the kind of activity that shows up in breach reports.
journald and syslog give you application logs, auth logs, and kernel messages. The most useful file is /var/log/auth.log (or journalctl -u ssh on systemd systems): every SSH login attempt, success, failure, and sudo invocation is there. Boring and essential.
Host logs — Windows
Windows Security Event Log is the primary source. The events that matter for detection: 4624 (successful logon), 4625 (failed logon), 4648 (logon with explicit credentials, common in pass-the-hash), 4688 (new process created — enable command-line logging), 4698/4702 (scheduled task created/modified), 7045 (new service installed). That’s your starter list; you don’t need all 1,000 event IDs.
Sysmon takes Windows logging from “adequate” to “genuinely useful.” It’s a Microsoft Sysinternals tool that runs as a driver and produces rich events for process creation, network connections, file creation, registry changes, and more — all with hashes and parent process info. The SwiftOnSecurity config is the standard baseline. If you have any Windows machines in your lab, install Sysmon on them. The improvement in detection quality is significant.
Network logs
Network visibility is what catches the things that never touch your hosts — lateral movement, command-and-control, DNS exfiltration.
Zeek (formerly Bro) runs on a tap or span port and produces structured logs for every protocol it understands: HTTP, DNS, TLS (metadata, not decrypted content), SSH, SMB. A single Zeek log line for a DNS query tells you the querying host, the query name, the response, the query type, and the answer TTL. That’s enough to catch DNS tunneling and C2 beaconing by pattern.
Suricata does signature-based detection on network traffic — it’s the IDS/IPS layer. Point it at your network interface and load the Emerging Threats ruleset and it will flag known-bad patterns: malware traffic signatures, exploit kit callbacks, cryptocurrency mining, anomalous protocols. False positive rate is manageable if you tune the rules to your network; untouched, it will generate a lot of noise you have to work through.
If you have a firewall — pfSense, OPNsense, or even just UFW logs forwarded from your hosts — collect it. Firewall logs tell you what connections were allowed and denied, which is the coarsest possible network visibility but still useful for spotting unexpected outbound connections or port scanning.
DNS — Pi-hole is a gift here
If you’re running Pi-hole for ad blocking (and if you’re homelabbing, you probably are), you’re already sitting on a DNS log source that most small organizations would pay for. Every DNS query from every device on your network passes through it. Enable query logging, ship those logs into your pipeline, and you get:
- A full record of every domain every device resolved
- Baseline normal DNS behavior per host (so anomalies stick out)
- Easy detection of devices talking to newly-registered domains, DGA patterns, or known-bad domains
It’s almost comically underused as a security telemetry source. Collect it.
Service logs
nginx access logs and error logs. SSH auth logs (already covered above). Any application logs your services produce. These are lower-priority than host and network, but they close the gap when you’re trying to reconstruct what happened to a specific service.
Collection and Shipping Agents
You have log sources. You need something to read them and move the events somewhere central. This is the collection layer, and the three tools worth knowing for a homelab are:
Wazuh agent — if you’re running Wazuh as your SIEM (more on this below), the Wazuh agent handles collection and ships to the Wazuh manager. It reads local log files, integrates with auditd, runs integrity checking, and handles a lot of the parsing. For a Wazuh-centric setup, you just deploy the agent and point it at the manager.
Elastic Agent / Beats family — if you’re running the Elastic Stack, Filebeat is the standard log shipper: it tails log files and ships them to Elasticsearch or Logstash. Winlogbeat is the Windows-specific equivalent for Event Log. Elastic Agent is the unified replacement for the individual Beats — it does collection, parsing, and detection in a single binary. More config overhead upfront, but cleaner at scale.
Fluent Bit — a lightweight, vendor-neutral log forwarder written in C. Lower resource footprint than the others, which matters when you’re running it as a sidecar on a machine that’s doing other things. Worth considering for resource-constrained hosts.
On normalization and why it matters
Raw log formats are a mess. sshd writes one thing, nginx writes another, Windows Event Log writes something completely different. Detection rules that operate on raw text are brittle — they break when a log format changes, and they can’t correlate across sources.
Normalization solves this by mapping everything to a common schema. The standard in the open-source world is ECS — Elastic Common Schema: consistent field names across event types (source.ip, destination.port, process.name, event.outcome). When your Linux auth log and your Windows Security log both normalize to ECS, you can write one detection rule that fires on failed authentication from any source. Without normalization, you write two rules, then six, then give up maintaining them.
The collection agent usually handles normalization before shipping. Wazuh has its own decoder/rule format. Elastic Agent includes ingest pipelines. The point is: don’t ship raw text if you can help it. Normalized events at rest mean faster detection rules and easier queries.
SIEM Choice for a Homelab
This is where most guides either pick a vendor without justifying it or give you a list so long it’s useless. Here’s a plain comparison:
| Option | What it is | RAM / Effort | Best for |
|---|---|---|---|
| Security Onion | All-in-one distribution: Zeek + Suricata + Elastic + Kibana + TheHive, pre-integrated | 16 GB minimum, steep first-run curve | Serious homelabbers who want everything pre-wired and are willing to trade flexibility for batteries-included |
| Wazuh | HIDS + SIEM hybrid: agent-based collection, detection rules, compliance dashboards, XDR capabilities | 4–8 GB workable, moderate setup | Best starting point for most homelabs; good docs, active community, real detection out of the box |
| Elastic Stack | Elasticsearch + Kibana + Elastic Agent/Fleet; most flexible, most powerful querying | 8–16 GB practical minimum, high config overhead | If you want full control over your pipeline and are willing to build detection rules yourself |
| Graylog + OpenSearch | Log management platform; excellent search and alerting, weaker on HIDS/endpoint | 6–8 GB workable, moderate setup | Log-centric use cases where you want good search and alerting without committing to the Elastic ecosystem |
My concrete recommendation for starting out: Wazuh.
Here’s why. Security Onion is technically impressive but it’s a serious machine commitment, and the setup complexity front-loads a lot of friction that gets in the way of learning detection. Elastic is fantastic but you’ll spend your first month configuring pipelines before you get a single useful alert. Graylog is strong but leans toward log management rather than security operations.
Wazuh hits the practical sweet spot: real HIDS capability out of the box, a detection rule library that covers common attack techniques, a web dashboard for triage, and enough documentation that you can troubleshoot when things go sideways. Once you’ve outgrown Wazuh — once you’re shipping network logs and want custom correlation rules and a graph-based threat hunt view — you’ll know exactly what you need and why. Start there.
T1/T2/T3 Reframed for a Solo Homelabber
In enterprise security, T1/T2/T3 refers to analyst tiers — different people with different skill levels handling different depths of investigation. In a homelab, you are all three tiers, and that’s fine. Reframe the tiers as workflow stages you rotate through:
T1 — Triage: An alert fired. Is it real? Is it a known false positive? Is this something that can be closed in under two minutes? This is where you spend the most time. The goal is to close the noise as fast as possible so the signal can surface. Good detection rules and a well-tuned baseline cut T1 time dramatically — which is why normalization and rule quality matter more than alert volume.
T2 — Investigate: Something passed T1 and looks real. Now you’re correlating: what else was happening on that host at that time? Was there network activity to match? What processes were running? This is where good logs pay off. If you only collected auth logs, you’re guessing. If you have auditd, Sysmon, and Zeek, you can reconstruct the timeline.
T3 — Hunt and engineer: No alert fired, but you want to look for something specific. Or you found a gap in your detection coverage and want to write a rule for it. This is the proactive mode: threat hunting, detection engineering, building the playbooks that make T1 faster next time.
A healthy homelab SOC practice rotates through all three. Don’t just watch the alert feed — spend time at T3 even when nothing is firing.
Storage and Retention Reality
This is where homelab SOCs usually go wrong. You set up a SIEM, it starts ingesting logs, and three months later your disk is 90% full and Elasticsearch is refusing writes.
The practical framework: hot vs. warm vs. cold.
- Hot data is fully indexed, searchable in seconds, in active retention. This is your recent events — the last 30 to 90 days, depending on your disk.
- Warm data is compressed, slower to search, but still accessible. Some stacks support this natively (Elasticsearch ILM, for example).
- Cold is archived off the box entirely — a tarball on a NAS, a compressed export on an external drive. You need this for incidents where the relevant activity happened months ago.
What’s a sane retention window at home? For hot data: 30 days is workable on most single-box setups. 90 days if you have the disk. For security research rather than incident response, even 14 days gives you enough context for most detections.
Rough disk math: Wazuh with a few agents and moderate log volume runs somewhere between 5–20 GB per week depending on how much you’re collecting. Zeek on a busy home network can add another 5–15 GB per week. Plan from there — don’t add sources faster than you add disk.
Field note: don’t starve the box.
A SIEM that’s disk-full is worse than no SIEM — it silently stops writing events while appearing to work. Set up disk utilization alerts before you start ingesting data. Check your ingest rate after the first week and project forward. The right move is to scope your log sources to what you can retain and triage, then expand incrementally. Collecting everything is not a virtue if you can’t store it or act on it.
Storage sizing is also covered in preparing your VM — the numbers there apply here too, and they’ll need scaling upward if this machine doubles as your SOC.
Quick Reference: The Full Pipeline
| Layer | Tool options | What it buys you |
|---|---|---|
| Log sources | auditd, journald, Sysmon, pfSense/OPNsense, Pi-hole | Raw events at the point of activity |
| Network visibility | Zeek, Suricata | Protocol-level and signature-based network telemetry |
| Collection/shipping | Wazuh agent, Elastic Agent, Filebeat/Winlogbeat, Fluent Bit | Centralized, reliable event delivery |
| Normalization | ECS, Wazuh decoders, Logstash pipelines | Consistent schema for detection and search |
| Store/index (SIEM) | Wazuh, Elastic Stack, Security Onion, Graylog | Searchable, persistent event storage |
| Detection | Wazuh rules, Sigma, Elastic SIEM rules | Automated identification of threat patterns |
| Alerting | Telegram/email via Wazuh hooks, Elastalert | Human notification when something matches |
| Triage/dashboards | Wazuh dashboard, Kibana, Grafana | Workflow for investigating and closing alerts |
Next Up
With the architecture clear, the next post gets into the work that makes a SOC useful: Threat Hunting in Your Homelab — proactive detection, hypothesis-driven hunting, and how to find things that didn’t fire an alert.